> For the complete documentation index, see [llms.txt](https://docs.sola.security/llms.txt). Markdown versions of documentation pages are available by appending `.md` to page URLs; this page is available as [Markdown](https://docs.sola.security/getting-started/sola-ai/security-graph.md).
# Security Graph
AI with unparalleled visibility into your environment
Sola's **security graph** is an advanced reasoning intelligence layer in [Sola AI](/getting-started/sola-ai.md) that maps the relationships and connections between resources, security controls, and risks across your connected data sources.
It uses a **proprietary analysis infrastructure and framework**, to answer complex questions with a holistic view, contextualized data, and visually-backed responses.
This allows Sola to surface deep insights, providing:
* **Enterprise-grade reasoning** - Responses are grounded in a security graph built from Sola's domain expertise.
* **Valuable insights for complex cross-environment analysis** - Each insight is traceable to relationships across entities and controls.
* **Security intelligence built-in** - Combines context-aware reasoning with proven knowledge of risk, exposure paths, and misconfigurations.
* **Deep analysis, intuitive results** - Sola analyzes and maps your assets, identities, and security controls to surface connections and risks across your environment.
## What security graph reveals
Sola's security graph goes beyond basic analysis to provide you with contextual, robust, precise insights based on your connected data.
Each insight is complete and grounded in real security context, validated through identified connections between assets and controls.
* **Connection insights** - Surface previously unseen connections and dependencies between different types of environments and assets.
* **Toxic combinations** - Detect risky interdependencies across platforms (e.g. overly permissive GitHub access combined with exposed AWS assets).
* **Blast radius for critical issues** - Understand the full scope of impact from a single misconfiguration or compromised entity.
* **Security impact on infrastructure** - Trace how issues in one part of your environment affect services, workloads, and teams elsewhere.
## How it works
Sola's security graph is built from proprietary knowledge of cybersecurity architecture and risk patterns, mapping the connections between a wide range of asset types, security controls, and their relationships.
This knowledge is combined with your connected data sources to create a graph of real-time entities (such as users, roles, buckets, workloads, and more) and security controls (such as IAM, access levels, encryption, MFA, and more).
When analyzing your environment, Sola AI:
* Identifies relevant asset types.
* Discovers meaningful relationships and connections across systems.
* Generates grounded traceable insights based on entity interconnections.
### Lumina Signals and the security graph
[Lumina Signals](/workspace/lumina-signals.md) is powered by Sola's intelligence layer, a combination of AI reasoning, graph analysis, and security domain expertise that processes signals across all your connected data sources. It maps your environment as a relational graph, understanding how resources interact, exposing dependencies, access paths, and potential blast radius.
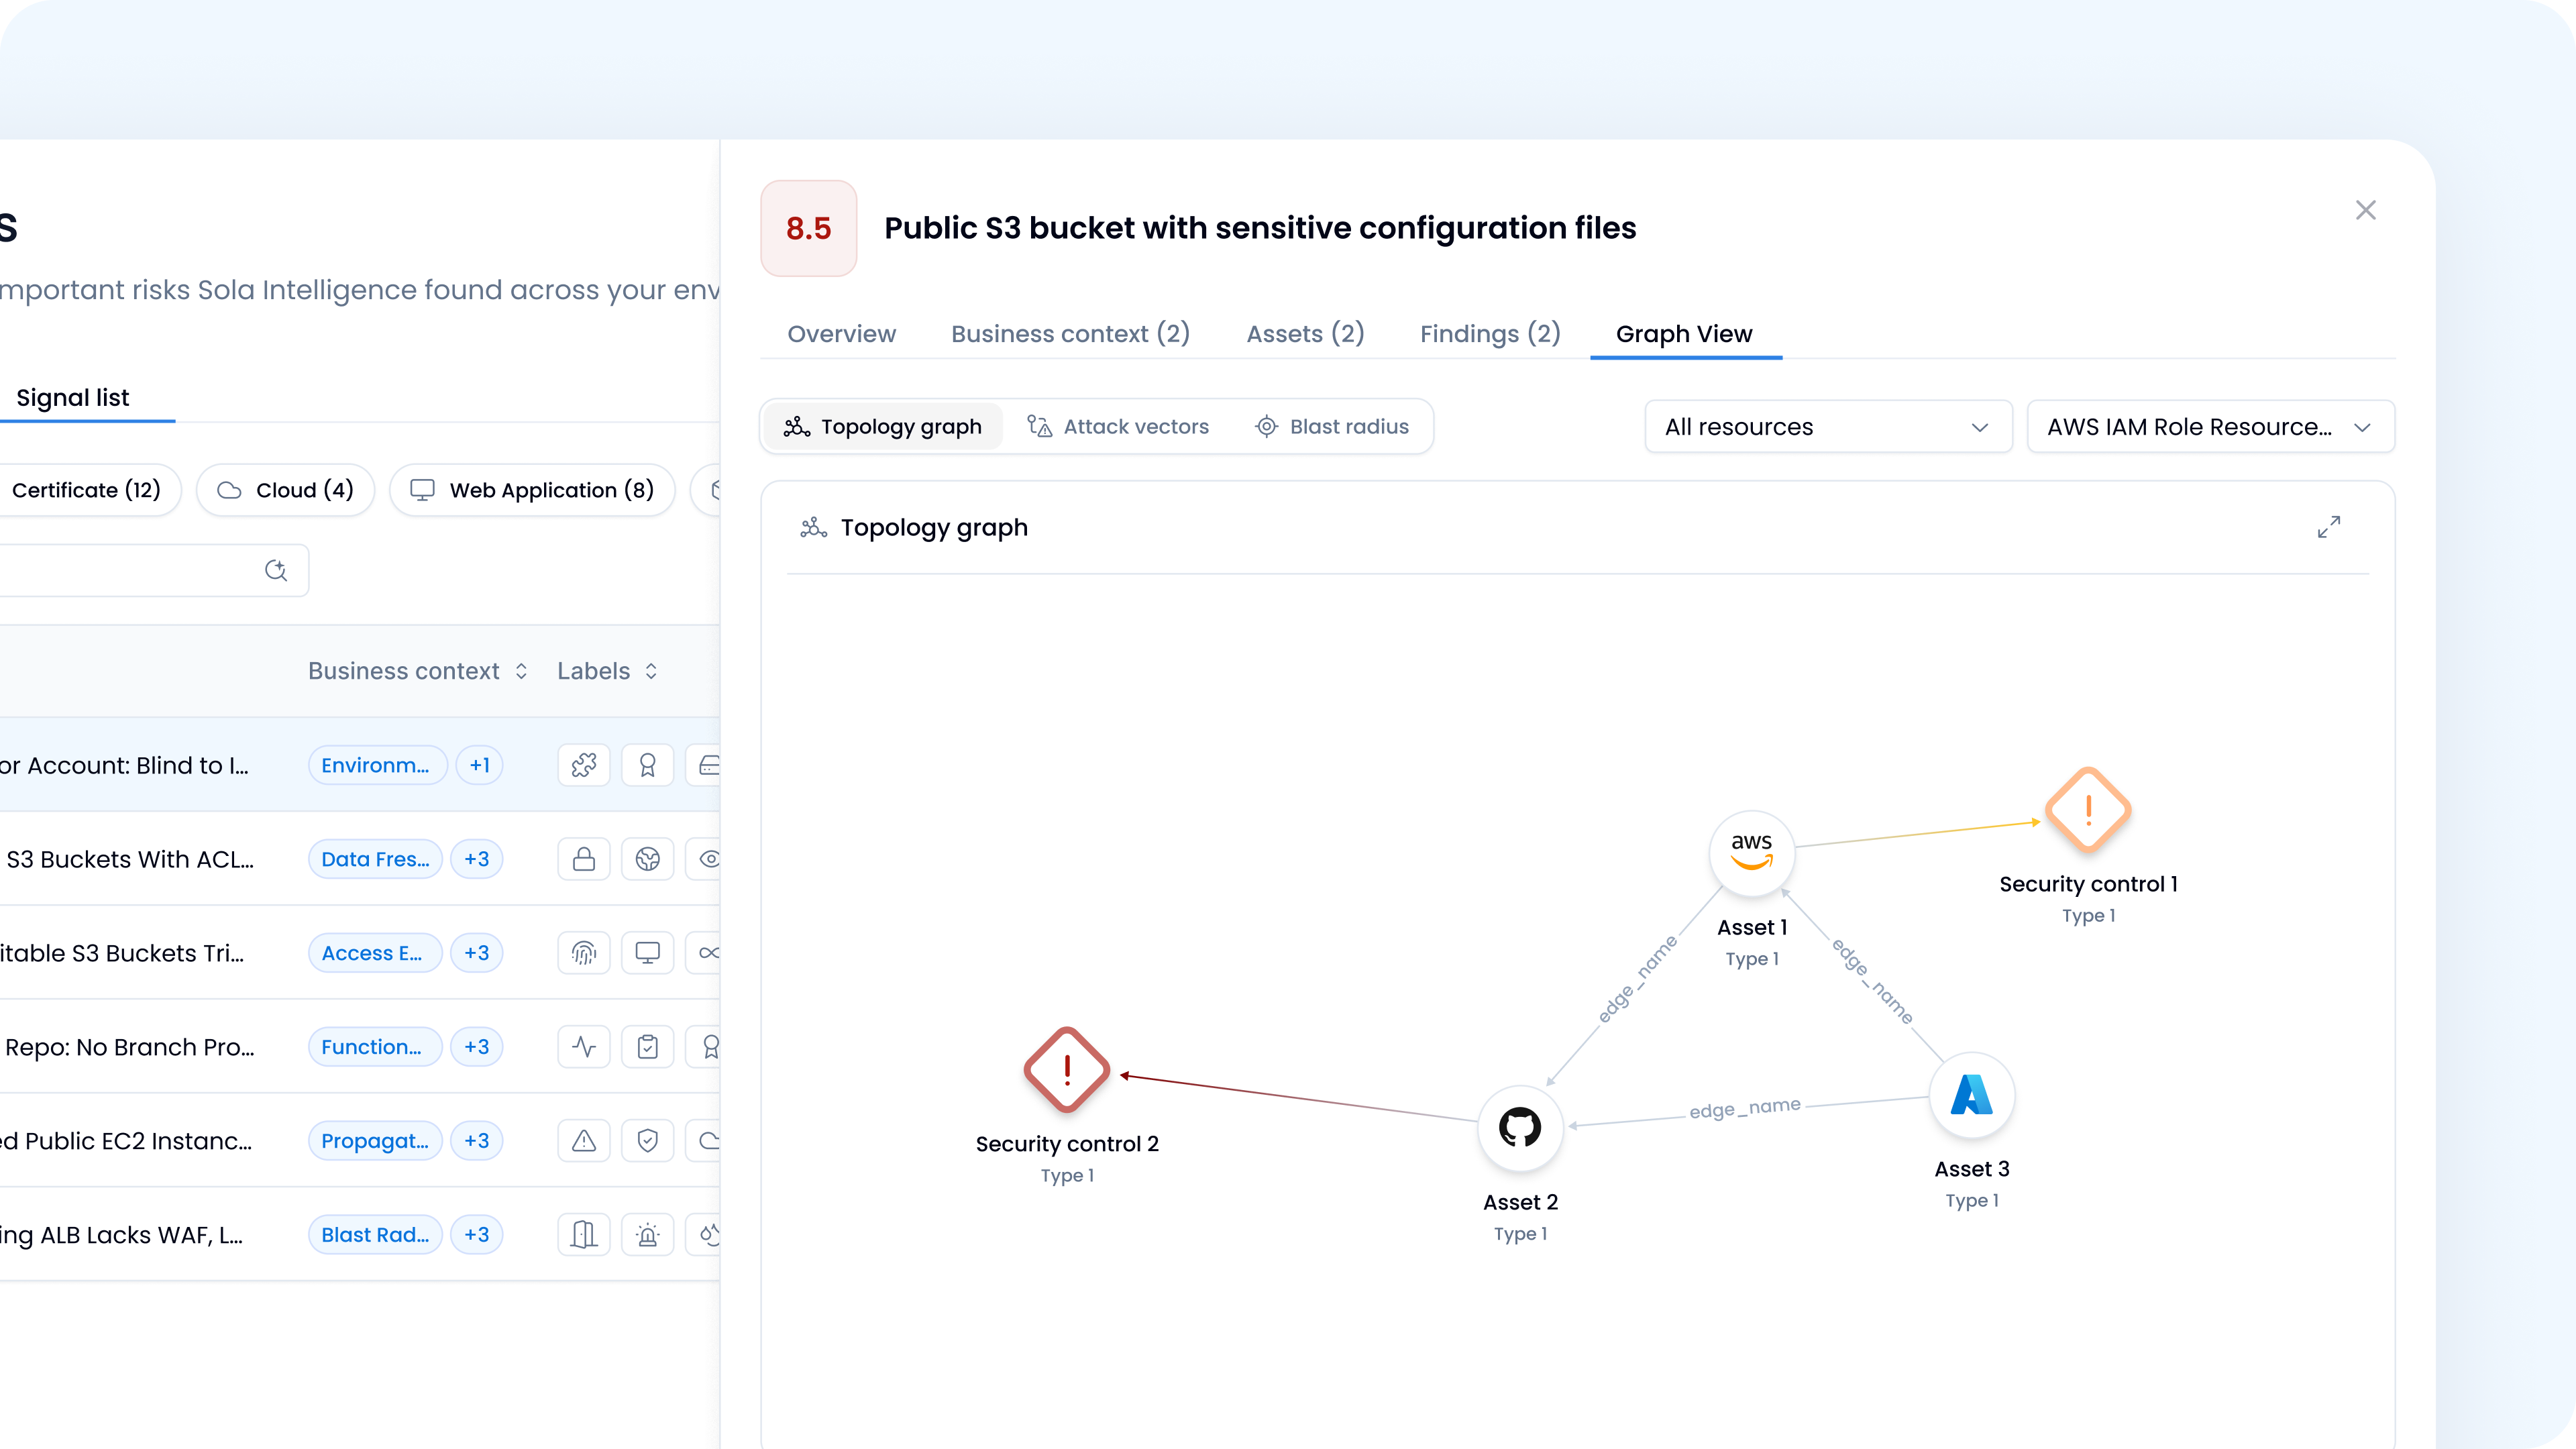
The Graph View tab within each signal provides a visual representation of the security graph behind it, showing the assets involved, their relationships, and potential attack vectors.
Lumina Signals - Graph View
Every signal is the result of security graph analysis across your entire connected environment, compressing thousands of data points into focused, ranked risk clusters. Each signal arrives with context, reasoning, blast radius, and recommended actions already assembled.
***
## FAQs
### What is Sola's security graph?
Sola's security graph is an advanced reasoning intelligence layer in Sola AI that maps the relationships and connections between resources, security controls, and risks across your connected data sources. It uses proprietary knowledge of cybersecurity architecture to surface context, trace risk paths, and identify cross-environment dependencies.
### How does the security graph work?
The security graph combines Sola's built-in security knowledge with real-time data from your connected sources, creating a relational map of entities and controls. When analyzing your environment, it identifies asset types, discovers meaningful relationships across systems, and generates grounded, traceable insights.
### What makes the security graph different from regular analysis?
Regular analysis looks at individual data points within a single system. The security graph maps relationships across your entire environment, revealing cross-platform dependencies, toxic combinations, and blast radius from a single misconfiguration or compromised entity.
### Where do I see the security graph in action?
The security graph powers [Lumina Signals](/workspace/lumina-signals.md), Sola's daily feed of security risk signals. Each signal includes a Graph View tab with a visual map of the assets involved, their relationships, and potential attack vectors.
---
# Agent Instructions
This documentation is published with GitBook. GitBook is the documentation platform designed so that both humans and AI agents can read, navigate, and reason over technical content effectively. Learn more at gitbook.com.
## Querying This Documentation
If you need additional information that is not directly available in this page, you can query the documentation dynamically by asking a question.
Perform an HTTP GET request on the current page URL with the `ask` query parameter, and the optional `goal` query parameter:
```
GET https://docs.sola.security/getting-started/sola-ai/security-graph.md?ask=&goal=
```
`ask` is the immediate question: it should be specific, self-contained, and written in natural language.
`goal` is optional and describes the broader end goal you are ultimately trying to accomplish on behalf of the user. GitBook uses it to tailor the answer towards what is most useful for that goal.
The response will contain a direct answer to the question and relevant excerpts and sources from the documentation.
Use this mechanism when the answer is not explicitly present in the current page, you need clarification or additional context, or you want to retrieve related documentation sections.
.svg?alt=media&token=4ebffa91-4da9-4296-8ae8-e5c75c148a13) Learn more about AI-native asset intelligence
Learn more about AI-native asset intelligence